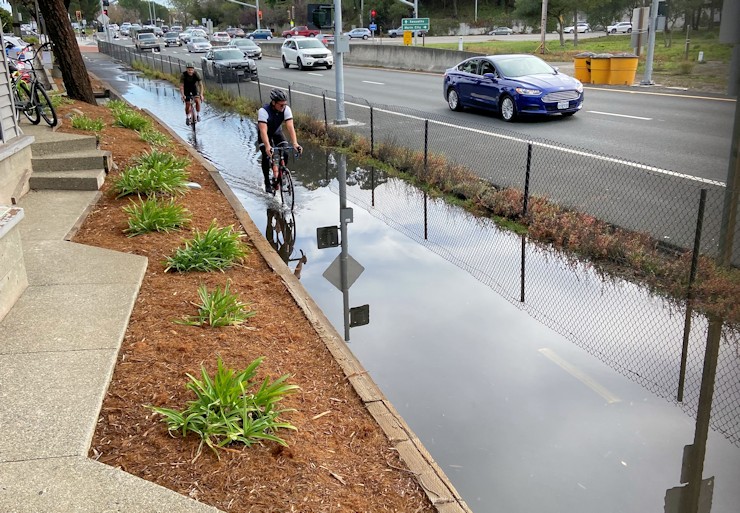
During the early winter months, the combination of the lunar phase and the solar perihelion (when the earth is closest to the sun) can generate especially high tides, also known as king tides. King tides that exceed 6.5′ typically cause street flooding in Sausalito, most often on Gate 5 Road and in sections of some floating home parking lots.
Tides exceeding 6.5′ are predicted for the following days in December:
- Thursday, December 2 at 9:18 a.m. (6.55′)
- Friday, December 3 at 9:57 a.m. (6.83′)
- Saturday, December 4 at 10:40 a.m. (6.99′)
- Sunday, December 5 at 11:26 a.m. (6.97′)
- Monday, December 6 at 12:15 p.m. (6.76′)
- Thursday, December 30 at 8:00 a.m. (6.5’)
- Friday, December 31 at 8:36 a.m. (6.9’)
And, happy new year: tides will be even higher in both early and late January. We’ll report those projections in late December, or you can look them up now by using the tide widget next to this post (or below it on mobile devices).
Rain, lowered barometric pressure as a result of winter storms, and wind (especially out of the south) can increase tide heights and inundation areas.
Check 511.org for the latest traffic and transit information if you are concerned about the effects of tides on traffic in the Bay Area. Motorists should always avoid driving through ponded water, as even six inches of standing water can stall a low–clearance car.
The California King Tides Project needs our help to photograph these king tides. You can find local king tide times, browse king tide photos, and find resources for educators and parents on the California King Tides Project website.
It’s easy to participate in this community science project:
1) Find your local high tide time for one of the king tides dates
2) On the coast, bay, or Delta, notice your surroundings to ensure you are safe and are not disturbing any animals
3) Make sure your phone’s location services are turned on for your camera and then take your photo. The best photos show the water level next to familiar landmarks such as cliffs, rocks, roads, buildings, bridge supports, sea walls, staircases, and piers.
4) Add your photo to the king tides map either by uploading it via the website or by using the Survey123 app. If you want to use the app, be sure to download it (free from your app store) before you head out.
Photos are important data for planners, researchers, and students locally and for the State of California and beyond. They help to understand what’s vulnerable to flooding today, plan for future sea level rise, and get us all talking and thinking about the impacts of climate disruption and what we can do to make a difference.
Sea Level Rise in Sausalito
On November 16, the Sausalito City Council received its most detailed report to date on the projected impacts of sea level rise here and what we can do to begin to prepare as a community.
The report is based on the best available science and hours of meetings with industry experts, regulators, academics, and researchers. It outlines a course of action for Sausalito by highlighting immediate, medium, and long–term opportunities to address the impacts of sea level rise.
A video recording of the November 16 presentation is available on the city website, along with the written report from the task force. Also available is a new FAQ which addresses eleven questions specifically related to sea level rise in our community, including: what is known about the amount and timing of sea level rise (SLR) in Sausalito? Here’s an excerpt of the answer to that one:
The amount and timing of future SLR is not known precisely. Scientists have created SLR models to project a range of sea levels based on current and future global warming. Sea level rise projections will continue to improve as scientific understanding increases and as the impacts of local, state, national, and global policy choices play out. We do know that:
From now until 2050, differences in sea-level rise projections in different models and under different emissions scenarios are relatively minor. For the San Francisco area, we should expect a 1-2 foot rise in water levels.
After 2050, sea-level rise projections increasingly depend on the trajectory of greenhouse gas emissions and the rate of ice sheet loss, thus there are a wide range of projections. For the San Francisco area, we should expect anywhere from 2.5—7-foot rise in waters.
Check back to the FAQ page, as the city will be adding more questions and answers on a regular basis.