
Climate change and global warming are frequently in the news. A rise in sea level is a significant consequence of global warming and is of special interest to coastal communities. Even though our homes and boats may float, they are dependent on docks and parking lots which do not. In this first post I will describe how sea level is measured and examine the past record and future predictions for the San Francisco Bay area. In a second essay, Global sea levels, I will discuss variation of sea levels around the world. The level of the sea reveals a great deal about the nature of the planet we live on, which makes it both complicated and interesting.
Building a station
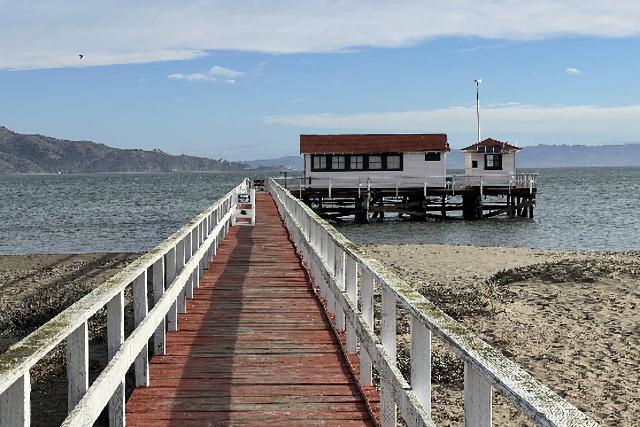
We can measure sea level by comparing the position of a float on the water to a position on land. Our parking lots and Gate 5 road are mostly built on fill, dirt and rocks that were used in 1942 to create the Marinship, a group of buildings and five shipways on which freighters and tankers were built during WWII. While the fill was compacted at the time, it’s impossible to prevent this type of fill from progressively sinking over years; and significant ground settling is indeed observed in many locations in the Marinship area. So, let’s pick a solid looking pier some distance out from the land fill, which will also decrease the influence of waves breaking on the shore. The end of South 40 Pier would be convenient for me.
In our imagination (so we don’t have to ask permission from the harbor master) attach a float connected to a device that continually records the vertical position of the float. Then enclose the float with a long box or tube with small holes, that isolates the float from wave action but still allows hourly changes in sea level to control its position. A roof and a little red paint (so it looks good on our You Tube post) and we have our station.
Defining and measuring the average sea level
The recorded sea levels for 48 hours will look like the first or second panels in Fig. 1. Usually there are two high and two low water levels a day. However, the levels can be very different with patterns varying by the location. Sometimes the peaks merge and appear as one peak a day, Some days the levels will change by 9 feet in one day, called spring (or king) tides, at other times only change a third as much, neap tides. The level defined as “0” is called the “datum”. These changes are of course tides, and our station would usually be called a tide station. The changes are caused by gravitation attraction between the moon and to a lesser extent the sun, and the ocean water. The center of the earth and center of the moon rotate around their center of mass about once a month. All locations on earth that are as distant from the moon as the center of the earth, feel no force: gravitational and centrifugal forces are balanced. However, locations on earth closer to the moon experience excess gravitational force toward the moon, while locations farther from the moon experience excess centrifugal force away the moon. Thus, there are typically two high and low tides a day. The moon travels around the earth-moon center of mass in the same direction as the earth’s 24 hour daily rotation. Thus, the earth must rotate almost an hour longer each day to maintain a constant angular position relative to the moon, and the tide peaks are thus about 50 minutes later each day.
For us the existence of tides is mainly an annoyance which will require us to measure the sea level over time and take some kind of average. Most mariners use a mean over many days of the higher low water (MHLW), and call that “0.0 feet”. However, a simple hourly mean sea level (MSL) is used in many geological studies.
Next, we need to specify how long sea level must be measured to get the mean. A year of values should give a value accurate to an inch or so. Serious work requires a period of about 19 years, because the positions of the lunar nodes and solar declinations repeat over that period. To really nail it down, the actual 19 year period of an average is specified and is called the National Tidal Datum Epoch, with 1983-2001 being the most recent.
Let’s cheat a little
We can cheat by using sea levels published by the National Oceanic and Atmospheric Administration (NOAA), one of the many groups of dedicated government employees supported by our taxes. NOAA is part of the Department of Commerce, which is logical since conditions in the oceans and atmosphere have a large influence on commerce. There are many private companies that provide tide tables, tide apps and specialized weather forecasts, but all use data provided by NOAA as a starting basis.
If we look at NOAA tide data for a location close by, we can use that value to calibrate our station. The Engineers Dock Station in front of the Bay Model is a subordinate station, about a quarter of a mile away and would be fine for us. However, station 941290, on a pier extending out from Golden Gate Beach in Crissy Field, just a few miles South of us, Fig. 2, is very special. It was established in 1854 and is the oldest continuously operating tide station in the Americas. A graph of sea level over these 170 years reveals a gradual increase of about 14 inches (0.35m).
We don’t need two people, one at our station and one at the Engineer’s Dock, communicating by cell phone, to synchronize the two readings at the same time. Just get a published set of tide level predictions and look up the tide level now. This is possible because the predicted tide levels for all the NOAA stations are published a year ahead of time and are free of charge. As long as there isn’t a storm these predicted values will be accurate to better than an inch.
Tides are predicted using a combination of theory and observation. The theory is astronomical; we know that the forces causing the tides are generated by the gravitational attractions of the moon and sun. The relative positions of both of these with respect to the earth are known with great precision for years to come, data again freely available from US Government sources. However, what is not known is the way in which the ocean, bay, or river water at our location responds to those forces: the magnitude and phase of the response. These are determined by temporarily placing a water level recorder at the location and collecting data for a year or more. Predictions for stations where data was collected for a short time are called subordinate, since the predictions will not be quite as accurate as for locations having long term data. The method for combining astronomical and measured data to predict the tides is called harmonic analysis, since the periodic motion of the sun and moon can be considered analogous to the rhythmical harmonics of music, a music of the tides. Today a year’s harmonic analysis for a station takes a few seconds on a desktop computer, but if you have to do it with pencil and paper it’s weeks of work. Before the invention of digital computers this work was done by a special purpose analog computer, a massive collection of gears and pullies that when set up with data from one location and slowly turned produced graphs of the tides. It could take hours to produce predictions for one location.
Wind, waves and weather maps
When air moves along the surface of the earth, toward or away from the equator, its distance from the earth’s axis of rotation changes. This produces a virtual force perpendicular to its direction, the Coriolis, which generates spiral winds, cyclones, with low pressure proportional to their speed, at its center. This low pressure is often associated with fronts of warm and cold air and rain or snow. Thus, falling atmospheric pressure suggests an approaching storm, and following changes of atmospheric pressure using a barometer was one of the earliest methods of predicting stormy weather.
Early barometers were tubes, sealed at the top and filled with mercury, which is 14 times as dense as water. The bottom of the tube was immersed in a reservoir of mercury. If the tube is longer than about 30 inches (760 mm), a vacuum space appears at the top, since the normal pressure of the atmosphere is equal to the pressure of a column of mercury of this height. Thus, the height of mercury in the tube, in inches, mm, or millibar is proportional to atmospheric pressure, with falling heights predicting an approaching storm. Today you don’t need a tube full of mercury. Go to Adafruit.com and purchase a DPS310, which can detect pressure changes of 0.002 hPa (1 hPa equals 1 millibar, normal atmospheric pressure is about 1000 millibar). It is a small board, about 1 x 1 inches in size, includes a temperature sensor, and will cost you only $6.95. You will need to connect it to a microprocessor and display of some type, but you will then have a little weather station for less than $50!
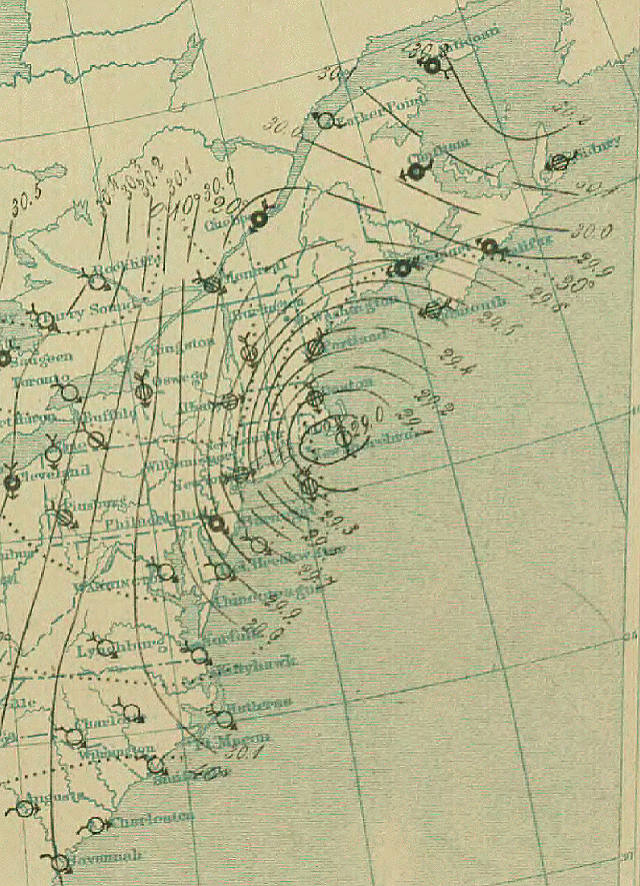
Surface weather maps show lines of constant atmospheric pressure, as lines on topographic maps indicate paths of constant height. The weather map in Fig. 3 shows a very low pressure center just South of Cape Cod during the “Great Blizzard” on March 12th, 1888. The wind arrows show wind revolving counterclockwise around the Low, the normal direction North of the equator. The pressure there was 29.0 inches, whereas the pressure was 30.5 inches over the Great Lakes. This pressure difference of 1.5 inches of mercury corresponds to about 2 feet of water, one component of the ocean surge that damages coastlines during hurricanes.
However, for us the larger increase in sea level due to a storm is likely to be due to wind driven waves. The wind in one of our typical storms is from the South and can thus drive surface waves along more than 20 miles, the wind fetch, from San Jose to us, a process called wind setup. The height of this setup, or surge, depends on wind speed and its duration. A South wind of 35 mph blowing for at least a day might be able to increase sea level 2 feet here. The height of the wind waves should be attenuated by the shallow depth of Richardson Bay, since we are at the extreme up end of the bay, however the surge will not be decreased as much.
Our little station at the end of South 40 Dock cannot hope to add much to actual tidal predictions for calm weather produced by NOAA, but because of the very local and complex nature of the effects of storms on sea level, it could contribute by recording the changes in sea levels during various storms and thus provide a guide for the future.
Sea levels past
In order to interpret current changes in sea level, in relation to global warming in the last century for example, it is necessary to examine changes over the last several thousand years that reveal other processes that might still be occurring. The last (Wisconsin) glacial period , which ended about 10,000 years ago had two effects on sea levels.
First, it generated thick ice sheets on land from water evaporating from oceans and falling as snow to create glaciers. This is a global process which lowered average sea level. During this ice age sea level was about 300 feet lower in our bay. Then the Sacramento River flowed through a large flat valley , now the bay, out through what is now the Golden Gate Strait but then was a narrow gorge, continuing across a flat sandy river delta that met the Pacific Ocean at what is today the Farallon Islands.
Second, the massive glaciers slightly compressed the earth’s crust, which increased apparent sea level. When the ice age ended, the glaciers melted, and the land slowly rebounded to its previous level, causing the apparent sea level to fall. However, this compression is somewhat local in nature. Glaciers mostly formed North of the present Canada-US border, so glacial rebound is unlikely to be seen in the record of sea level here.
If the recorded increase in sea level is causally linked to global temperature rise, one might expect a graph of temperature increase to be exactly proportional to sea level increase. The recorded increase in sea level in the San Francisco Bay is more or less a straight line, i.e. the increase is constant. However, effects of global warming on local sea levels are complicated, and are the sum of several processes, including thermal expansion due to ocean warming and addition of fresh water from melting terrestrial glaciers. The oceans have huge heat content compared to the atmosphere and the surface of the earth, which means is takes a lot of energy and time to raise their temperature. Most of ocean water is at great depth, over 1000 feet. Mixing of surface water, which absorbs the sun’s radiation, with this deep water, takes hundreds of years and is not well understood yet.
Part 2 (preview): Global sea levels
It’s difficult to talk much about the local sea level without drifting off into talking about sea levels elsewhere. After all, our bay is connected to all the oceans. However, describing sea levels around the globe will require different instruments, mathematics, and concepts. Stay tuned!