A while back the Environmental Committee discussed how our community could be better informed about our water usage, and if knowing how much water we use would affect our choices. Could immediately available feedback exert a positive effect on our behavior?
Individual water metering turned out to be prohibitively expensive, and sub-metering (at the start of each dock), though feasible, proved a non-starter. We then turned in search of available information, by looking at water usage (marina-wide) over the last few years.
While water usage data was not available for all docks, we believe that the information we found for East and West Piers is probably consistent with habits and trends for the other docks.
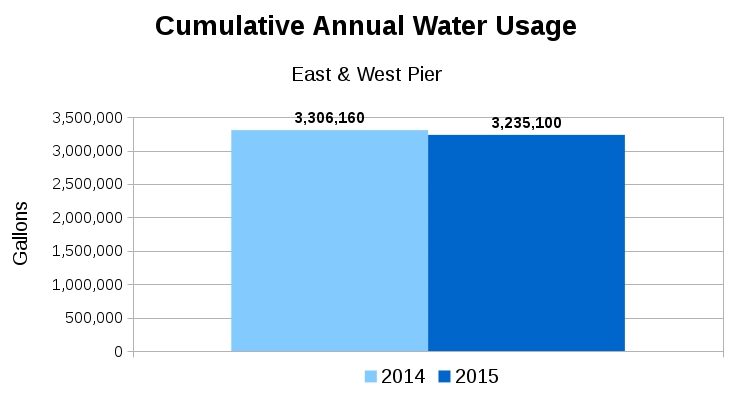
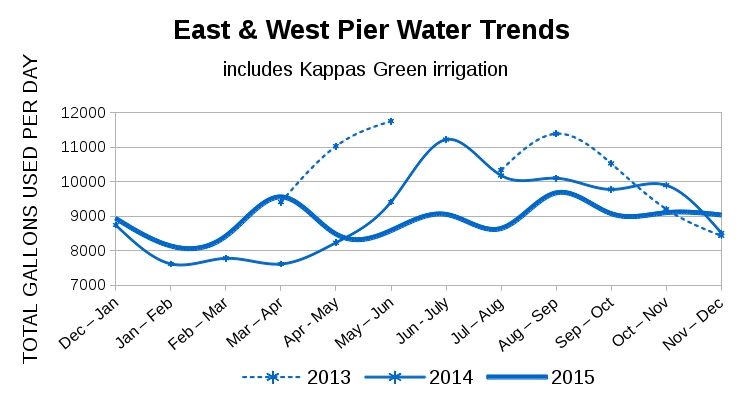
We found that East and West Pier’s 2015 annual water usage was 71,060 gallons less than in 2014. Then if we compare the most recent three years, we notice spikes in usage, perhaps due to the weather or dependent upon home renovations requiring lots of water. However, at least we can see a general downward trend in water usage from 2013 and again from 2014 onward.
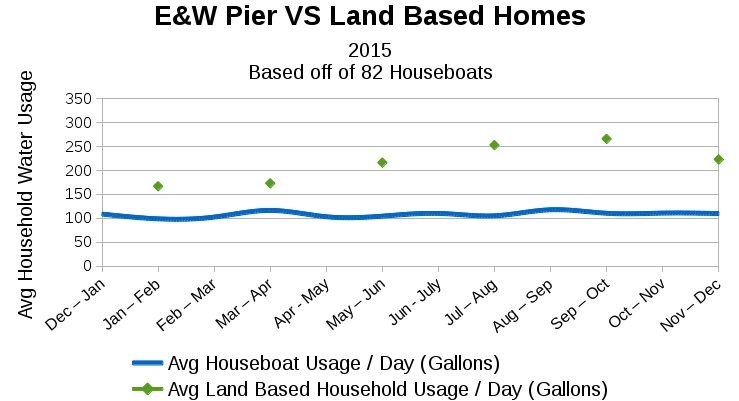
Even as land-based homes use more water in summer, in general our floating homes show more consistent water use throughout the year. Why should this be, if we are vigilant in turning off our irrigation during the winter months? Kappas intermittently turns off the irrigation (in response to rain) in the lead up to the rainy season, and all irrigation to the public areas is completely shut off from November through March or April. Is irrigation less a power-user than we thought it was?
Data is numbers. Information is power. We give statistics their meaning. Having looked at the water usage over the past few years, we wanted to share with you what we found, and to ask: “What do you think?”
To find out more information about our current water situation, visit the following sites: MMWD Water Watch and MMWD Drought Information.
Thanks to Kappas Harbormaster Ken Watsey and MMWD’s Craig Lauridsen for their patience, transparency and collaboration in providing the information that has enabled us to take a closer look at our water usage.
And finally, let us know what you think. Are there other aspects that you would be interested to see concerning our environmental impact on our surrounding community?
CLICK HERE to provide feedback to the Environmental Committee.
graphs by Dan Genter | post by Jenny Stein


